The DeviceAtlas APIs offer access to near instantaneous detection of tens of thousands of devices. That of course means that our customers have to heavily invest in oodles of RAM to keep the API and the data file in. Or do they?
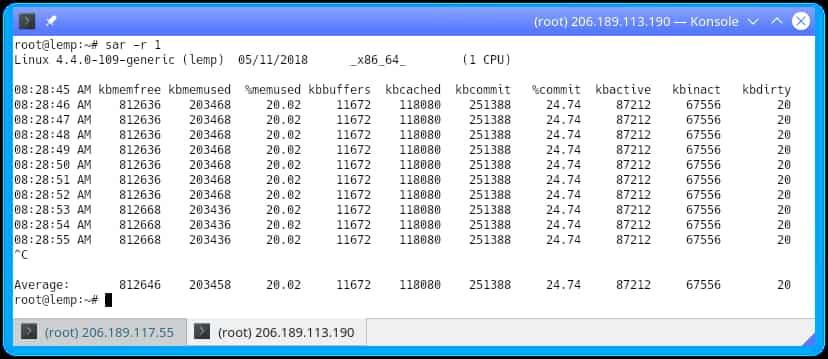
To find out how much extra memory a server would need to run a DeviceAtlas API, I started with a 1GB virtual private server with the Linux-NGINX-MySQL-PHP stack preinstalled. I turned off some irrelevant processes like snapd, mysqld and fail2ban and rebooted. Just after the reboot and with no load at all, the sar command reported just over 198MB of RAM used on this server.
This is a purely arbitrary measurement and a different reporting tool might show different figures. It's also important to note that at any time the server ran some processes that couldn't be switched off (i.e. systemd) and which did slightly affect the memory usage.

The friendly sar command
An idle server is not much use. What is then going to happen to the RAM usage if we put the vanilla LEMP machine under load? Using the Python Requests library I blasted just under 16k HTTP requests onto it for 10 minutes. All it did was to return the a page with the user agent from each request as detected by PHP. The RAM usage grew to over 217MB as an average over the 10 minutes.
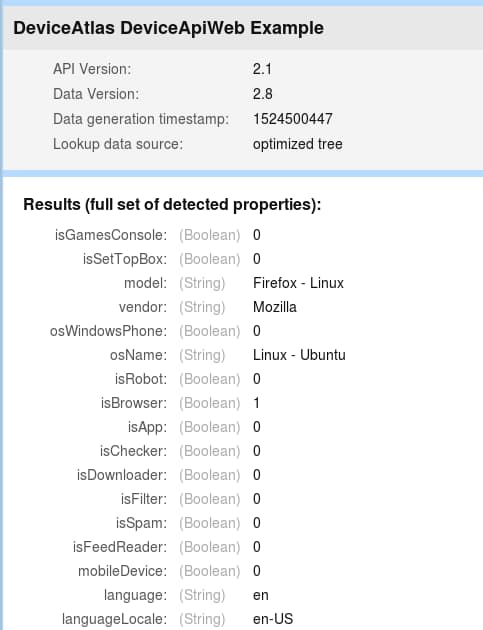
Let's now add DeviceAtlas to the mix. Instead of a boring "That's a 200, we are a-OK, here's your user agent back" response, the server will have to do a bit more work. NGINX will grab the user agent from the request, send it as a fastcgi parameter to the API which will return the properties and print them out as HTML to be sent back to the script.

The output of the PHP API example script
Here I used the DeviceAtlas PHP API and a few data files of various sizes and a file of user agents distilled from real world server logs. The specific script that I deployed to do the device detection had been optimized by the DeviceAtlas team to tax the system's memory as little as possible. It comes with the API, you can find it in the Examples directory as /DeviceApi/BasicUsage/web/using-tree-optimizer.php.
The results varied depending on the size of the data file, i.e. how many properties were included in it (you can set that in your DeviceAtlas account page). The table below compares the difference in memory used between running no DeviceAtlas API (BASE) and running it with various JSON files. Each value results from the average megabytes of RAM used over 10 minutes as reported by the sar command.
| LEMP+PHP API | BASE Without Device Atlas | DA with 25 properties | DA with 40 properties | DA with 80 properties | DA with 106 properties | DA with 180 properties |
|---|---|---|---|---|---|---|
| Memory usage in MB | 217.03 | +6.25 on top of BASE | +9.84 on top of BASE | +44.84 on top of BASE | +47.54 on top of BASE | +69.58 on top of BASE |
So we can see that with all the properties "maxed up", the API adds over 69MB to the RAM usage. For comparison, that's about a half of an idle mysqld process on a vanilla server.
What if we swap NGINX for Apache? Freshly rebooted and with nothing to do (well, bar the ssh connection from my PC) my LAMP server used over 198MB of RAM. That shot up to the average 235.03MB when serving a static webpage over 10 minutes. When I added DeviceAtlas API - the same optimized PHP as on LEMP - the usage went up as shown in the table below:
| LAMP+PHP API | BASE Without Device Atlas | DA with 25 properties | DA with 40 properties | DA with 80 properties | DA with 106 properties | DA with 180 properties |
|---|---|---|---|---|---|---|
| Memory usage in MB | 235.03 | +19.89 on top of BASE | +29.09 on top of BASE | +50.13 on top of BASE | +56.24 on top of BASE | +98.03 on top of BASE |
The usage is higher than on NGINX, but not by too much. Also the difference between no DeviceAtlas and all properties is only just over 98MB.
Now, let's try something a bit fancier than printing properties. DeviceAtlas is often deployed to deal with HTTP requests more efficiently. One of the example applications that come with the C API is an image resizer, that scales an image based on the screen dimensions of the visiting device.
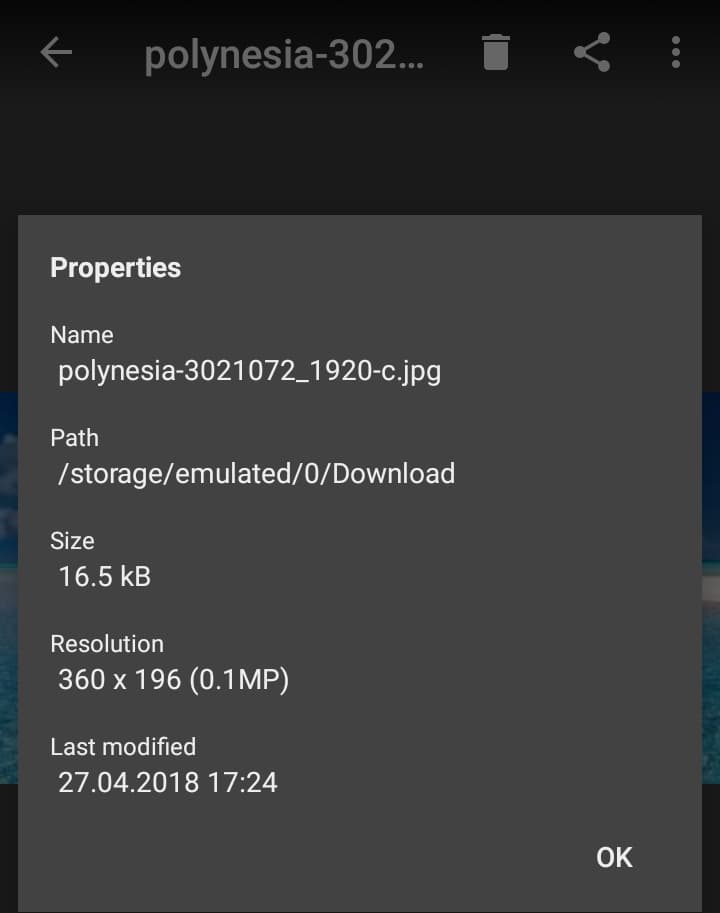
Consider a website that serves an image 1920 pixels wide and 1050 pixels tall. For small screen devices this is the definition of "overkill" and a waste of bandwidth and power. Our C API example uses NGINX scaling module to remedy this. Upon receiving a request containing an image, NGINX passes the user agent through the API, receives screen properties, passes those to the scaling module, receives an appropriately sized image and serves it to the visitor. The difference in images can be staggering: For example the Polynesian boat image was 480kB at full size but only 16.5kB when scaled to be served to a mobile phone.


The difference between the scaled and unscaled image size
For this feature to be available, you either need to compile NGINX together with our C API component or compile just the component and link it to the server dynamically. You'll need the DeviceAtlas library installed on the system as well. All this is well covered in the API documentation.
What is this detection and resizing going to cost you in RAM? To find out, I employed the Firefox Selenium web driver in combination with Python. In each of the two 10 minutes-long sessions, my script opened a site serving a Bootstrap carousel of 7 images in up to 4 browser windows at a time. The script used the user agents from before, in order to simulate traffic from all sorts of devices.


With the C API, the served images were scaled to the size appropriate to the device screen
In the first 10 minute run, the site didn’t use the DeviceAtlas API and served the big images indiscriminately. The average memory usage was over 259.38MB.
In the second stage, NGINX used the DeviceAtlas module to control the image resizer. Here I saw 285.08MB of RAM used.
So that’s 25.7MB. For this number to have any meaning, I also needed to know what kind of savings on transfer sizes these megabytes bought me. Here I chose a slightly different approach – I ran 50 browser visits to both the optimized and the non-optimized site using my file of real world user agents. After that I simply added up the “body bytes sent” from NGINX logs. The optimized site sent 63.89MB while the non-optimized one returned 108.32MB. That’s an extra 44.43MB!
So far I've been only using the DeviceAtlas API in a server setup. While this gives very valuable data, it lets the environment affect the measurements, as I mentioned above. Also, even when measuring the usage without the API, PHP, NGINX and other processes that the API uses still need to run, so the results show only a relative difference.
To measure just the usage of DeviceAtlas, I compiled the example0 program in the example folder of the C API. I fed it the list of user agents and logged the RAM usage measured with the ps command some 215 times per turn. (The measurements ran in parallel with the API call and if the call finished before them, it waited for them before the control script continued execution with the next user agent.) I did this for each of the data files from before plus the small 15 property file that I used in the image scenario and then I chose the highest memory usage from each run.
Interestingly, the 106 properties file had a lower usage than the 80 properties one - the actual results depend on the property coverage as well as on which properties the particular implementation asks the API for. The summary of all the measurements is the table below:
| C API | BASE DA with 15 properties | DA with 25 properties | DA with 40 properties | DA with 80 properties | DA with 106 properties | DA with 180 properties |
|---|---|---|---|---|---|---|
| Memory usage in MB | 22.52 | +10.52 on top of BASE | +10.55 on top of BASE | +26.48 on top of BASE | +26.28 on top of BASE | +49.98 on top of BASE |
Only over 22MB on the 15 properties file, thanks to the efficiency of the DeviceAtlas JSON structure and the inventive way that the API uses to query the file against incoming user agents. Not a big price to pay to be able to detect and identify tens of thousands of devices from a string of text less than 200 characters long!
In conclusion: the DeviceAtlas API enables access to up to 180 properties of tens of thousands devices in a split second. Even if you do need all the properties of every device available, you can get there under 67MB of RAM (or under 99MB on Apache) on top of the normal server usage. Thanks to the patented DeviceAtlas detection algorithm, the JSON file holding all the information is small – containing all properties it weighs in at 28MB uncompressed, 4.3MB compressed for download. The APIs are easy to implement and efficient.
DeviceAtlas users can utilize numerous ways of pushing the memory usage down and pushing efficiency further. For example, not many need the whole set of properties. The JSON file that I used for image scaling only needed properties related to screen resolution. Some use cases might only require the hardware type, or operating system properties.
The implementation and the API platform are important too. The C API is the most efficient, but a well optimized PHP or Java application might offer sufficient performance and more flexible deployment.
Add device awareness to your platform
All advertising and web analytics solutions need a high-speed, accurate, low server footprint solution to detect devices.
For this purpose you can use DeviceAtlas device detection available as a locally-deployed solution.


